

The price of any item is determined by the supply of that item, as well as market demand. The National Association of REALTORS (NAR) surveys “over 50,000 real estate practitioners about their expectations for home sales, prices and market conditions” for their monthly REALTORS Confidence Index.
Their latest edition sheds some light on the relationship between Seller Traffic (supply) and Buyer Traffic (demand).
Buyer Demand
The map below was created after asking the question: “How would you rate buyer traffic in your area?”
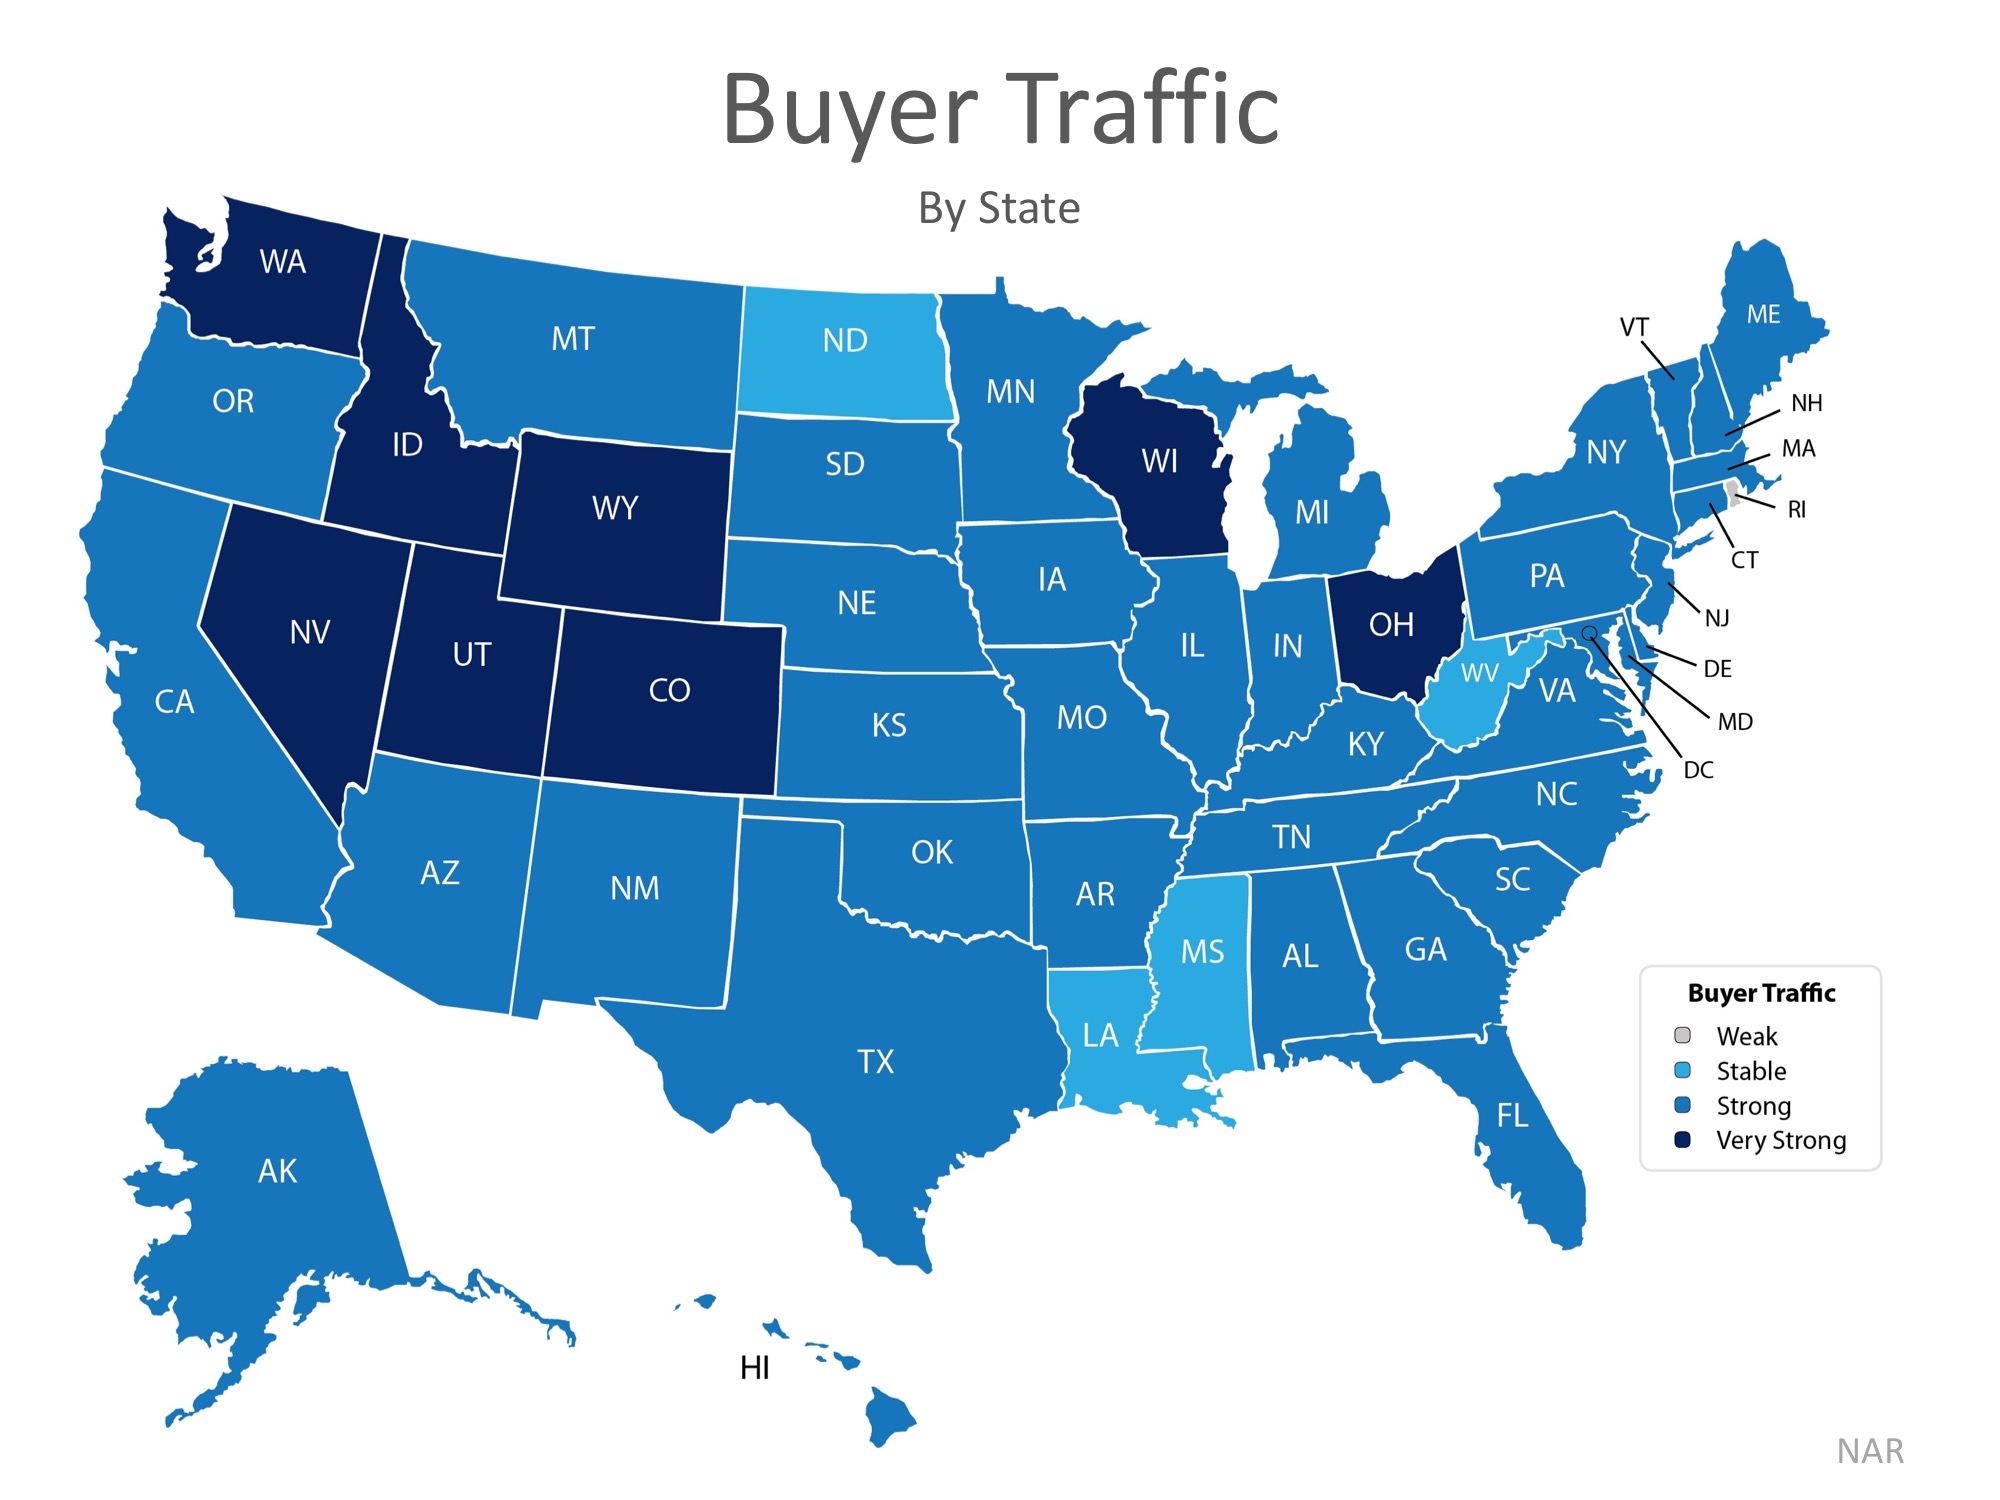
The darker the blue, the stronger the demand for homes in that area. Only four states had a ‘stable’ demand level.
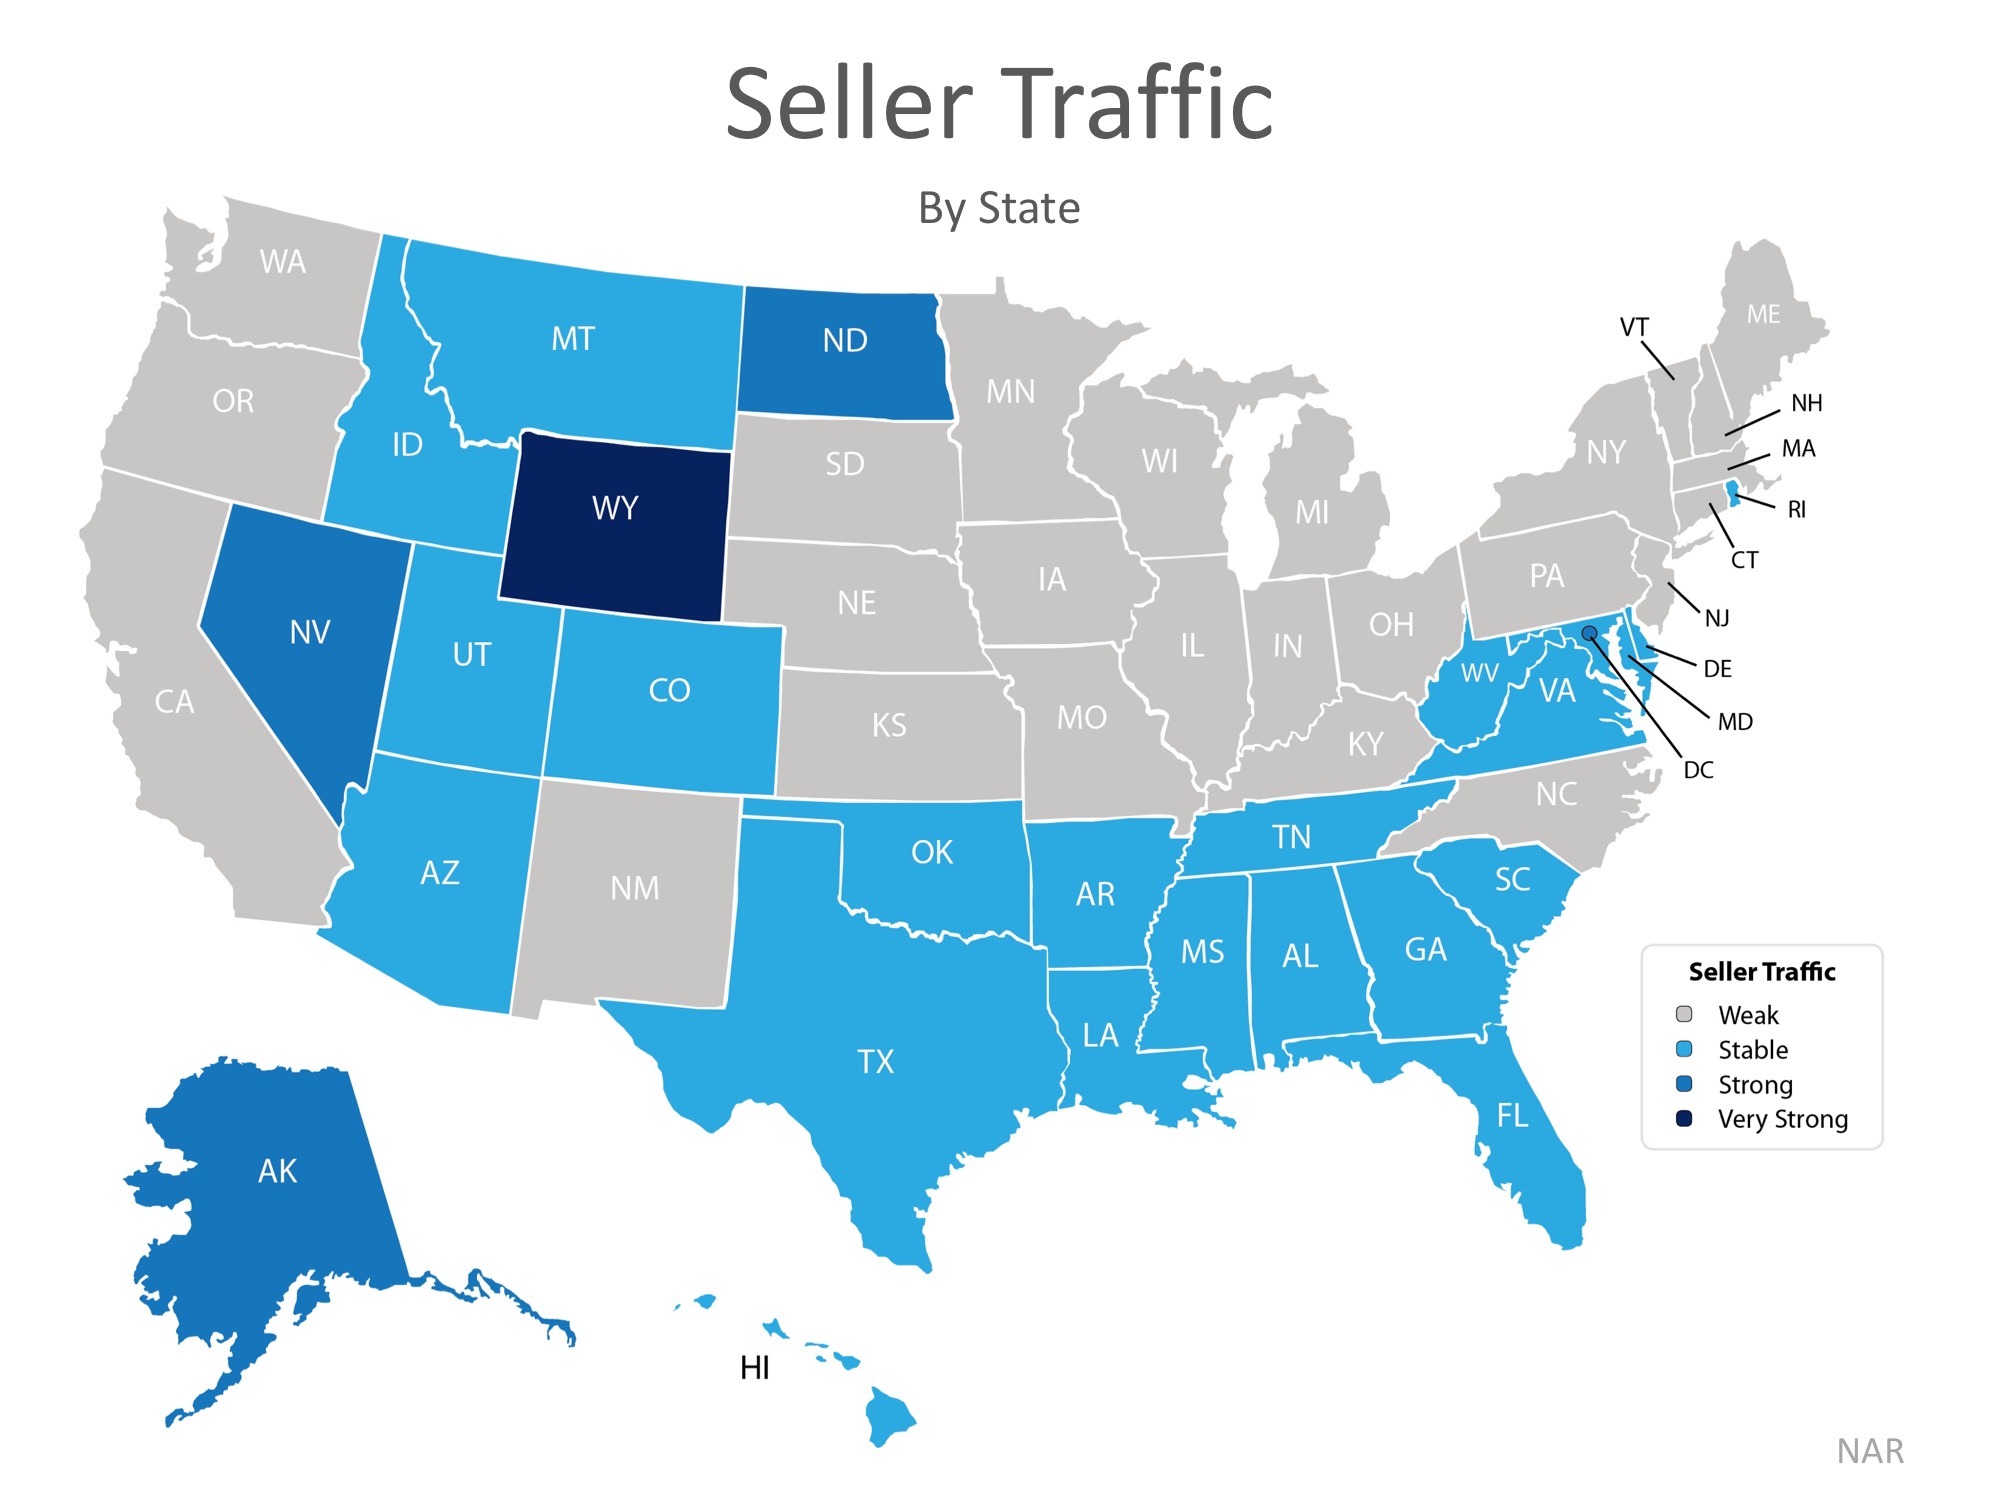
Seller Supply
The index also asked: “How would you rate seller traffic in your area?”
As you can see from the map below, 25 states reported ‘weak’ seller traffic, 21 states reported ‘stable’ seller traffic, 3 states and Washington D.C. reported ‘strong’ seller traffic, and only 1 state reported ‘very strong’ seller traffic. This means there are far fewer homes on the market than what is needed to satisfy the buyers who are out looking for their dream homes.
Bottom Line
Looking at the maps above, it is not hard to see why prices are appreciating in many areas of the country. Until the supply of homes for sale starts to meet buyer demand, prices will continue to increase. If you are debating listing your home for sale, let’s get together to help you capitalize on the demand in the market now!
Your real estate agent is the best source of information about the local community and real estate topics. Give Kevin Cooper a call today at 603-657-6787 to learn more about local areas, discuss selling a house or tour available homes for sale.